FINDING 1
Stress Is the Strongest Predictor of Sleep Quality
Stress level shows a very strong inverse relationship with sleep quality (r = –0.90). As stress increases, reported sleep quality declines sharply.
Among all variables analyzed, stress demonstrates the strongest statistical association with sleep outcomes. Individuals reporting lower stress consistently cluster in the highest sleep quality range, while high-stress individuals disproportionately report poorer sleep.
Within this dataset, psychological load appears more predictive of sleep disruption than demographic or most physiological variables. Sleep quality may be deeply tied to emotional regulation and stress management capacity.

FINDING 2
Sleep Duration and Sleep Quality Move Together
Sleep duration and sleep quality are strongly positively correlated (r = 0.88). Individuals sleeping longer hours generally report higher quality sleep.
Although duration and quality are conceptually distinct, they are closely aligned in this dataset. However, the relationship is not perfectly linear—some individuals report sufficient hours but moderate quality, suggesting that time alone does not guarantee restorative sleep.
Both quantity and quality matter. Sleep should not be evaluated solely by hours logged, but by perceived restfulness.
FINDING 3
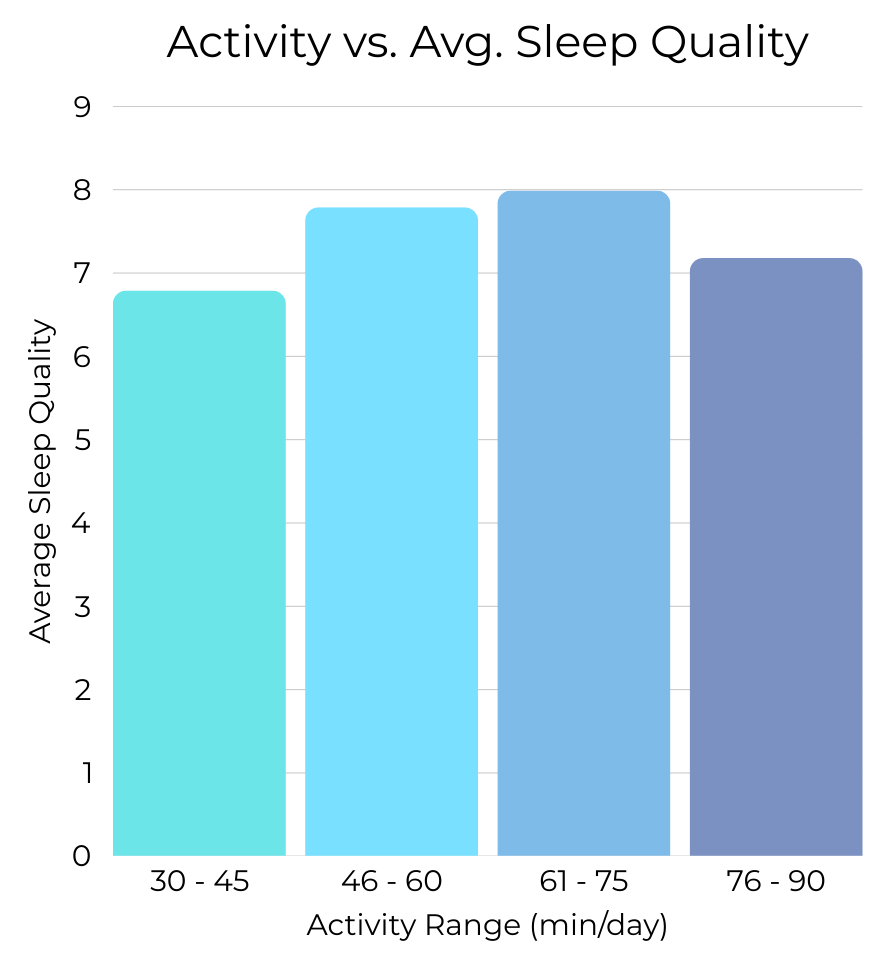
Moderate Movement Appears to Support Better Sleep
Sleep quality appears highest among individuals reporting moderate levels of daily physical activity. Both low activity and extremely high activity levels are associated with lower average sleep scores, forming a bell-shaped pattern rather than a linear trend.
The weak linear correlation suggests that movement does not operate in a simple “more is better” pattern. Instead, the data points toward an optimal behavioral range in which moderate physical activity supports sleep, while insufficient movement—or potentially overexertion—may reduce restorative outcomes.
Balance appears more important than intensity. Sleep quality may benefit from regulated movement rather than extremes.
FINDING 4
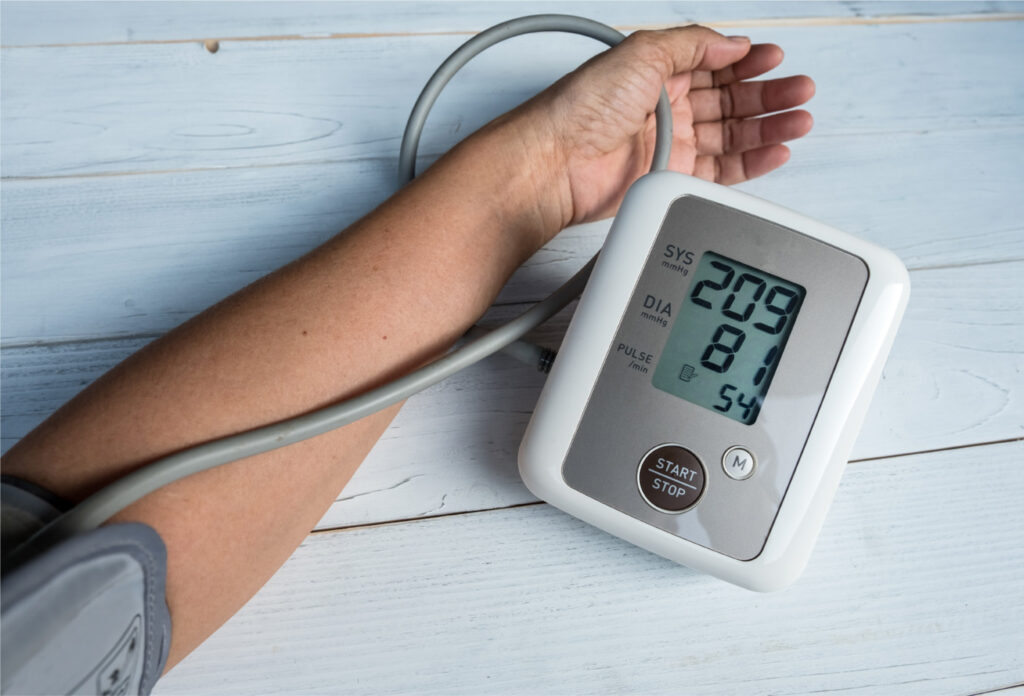
Physiological Markers Show Weaker Direct Patterns
BMI, blood pressure, and heart rate display more dispersed relationships with sleep quality. For example, resting heart rate shows a moderate inverse relationship with sleep quality (r ≈ –0.66), indicating that individuals with elevated heart rates tend to report poorer sleep.
Physiological markers appear associated with sleep, but not as strongly as stress or duration. Elevated heart rate, often linked to stress or cardiovascular strain, aligns with reduced sleep quality.
Sleep may reflect overall autonomic regulation. Physiological strain appears connected to sleep outcomes, but psychological factors remain stronger predictors in this dataset.
FINDING 5
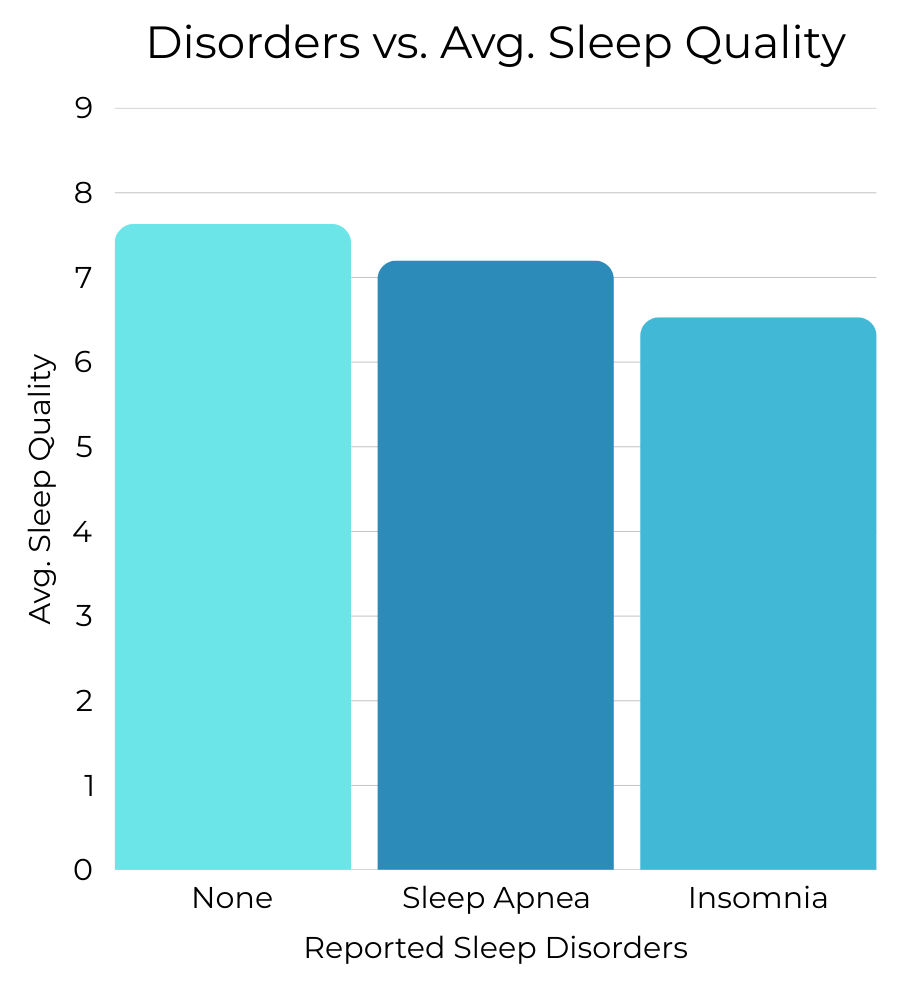
Sleep Disorders Create Clear Separation
Participants reporting diagnosed sleep disorders consistently show lower average sleep quality.
While lifestyle and stress factors influence sleep, diagnosed sleep disorders create a distinct separation in outcomes. Insomnia, in particular, is associated with both shorter sleep duration and lower perceived quality.
Behavioral optimization may improve sleep outcomes, but clinical sleep disorders likely require distinct intervention strategies beyond lifestyle adjustment alone.
A Systems Perspective on Sleep
Sleep quality emerges from an underlying behavioral and physiological architecture of:
- Psychological load (stress)
- Behavioral recovery (sleep duration and movement patterns)
- Physiological regulation (heart rate, BMI)
- Clinical conditions (sleep disorders)
A notable example: the insomnia group also reports higher average stress levels, reinforcing the dataset’s broader pattern linking psychological load to sleep disruption.
- Insomnia group stress average = 5.87
- No disorder group stress average = 5.11
Sleep, in this dataset, is not random.
It is patterned — but multi-determined.